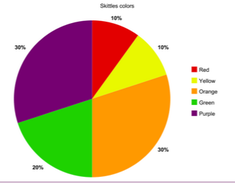
Are class did a P.I.E chart on 'colors of skittles'.
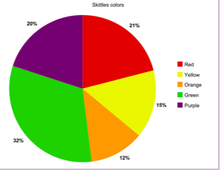
The one on the left Is out of 10 skittle colors.The one on the right is out of 100 skittles. The one on the left has a less chance of getting the right amount of skittles percent.The one on the right has a better chance of getting the percent because there is more skittles to work with.So the more there is the better the chance is of getting a percent right.
The one on the left Is out of 10 skittle colors.The one on the right is out of 100 skittles. The one on the left has a less chance of getting the right amount of skittles percent.The one on the right has a better chance of getting the percent because there is more skittles to work with.So the more there is the better the chance is of getting a percent right.
| 
|
 RSS Feed